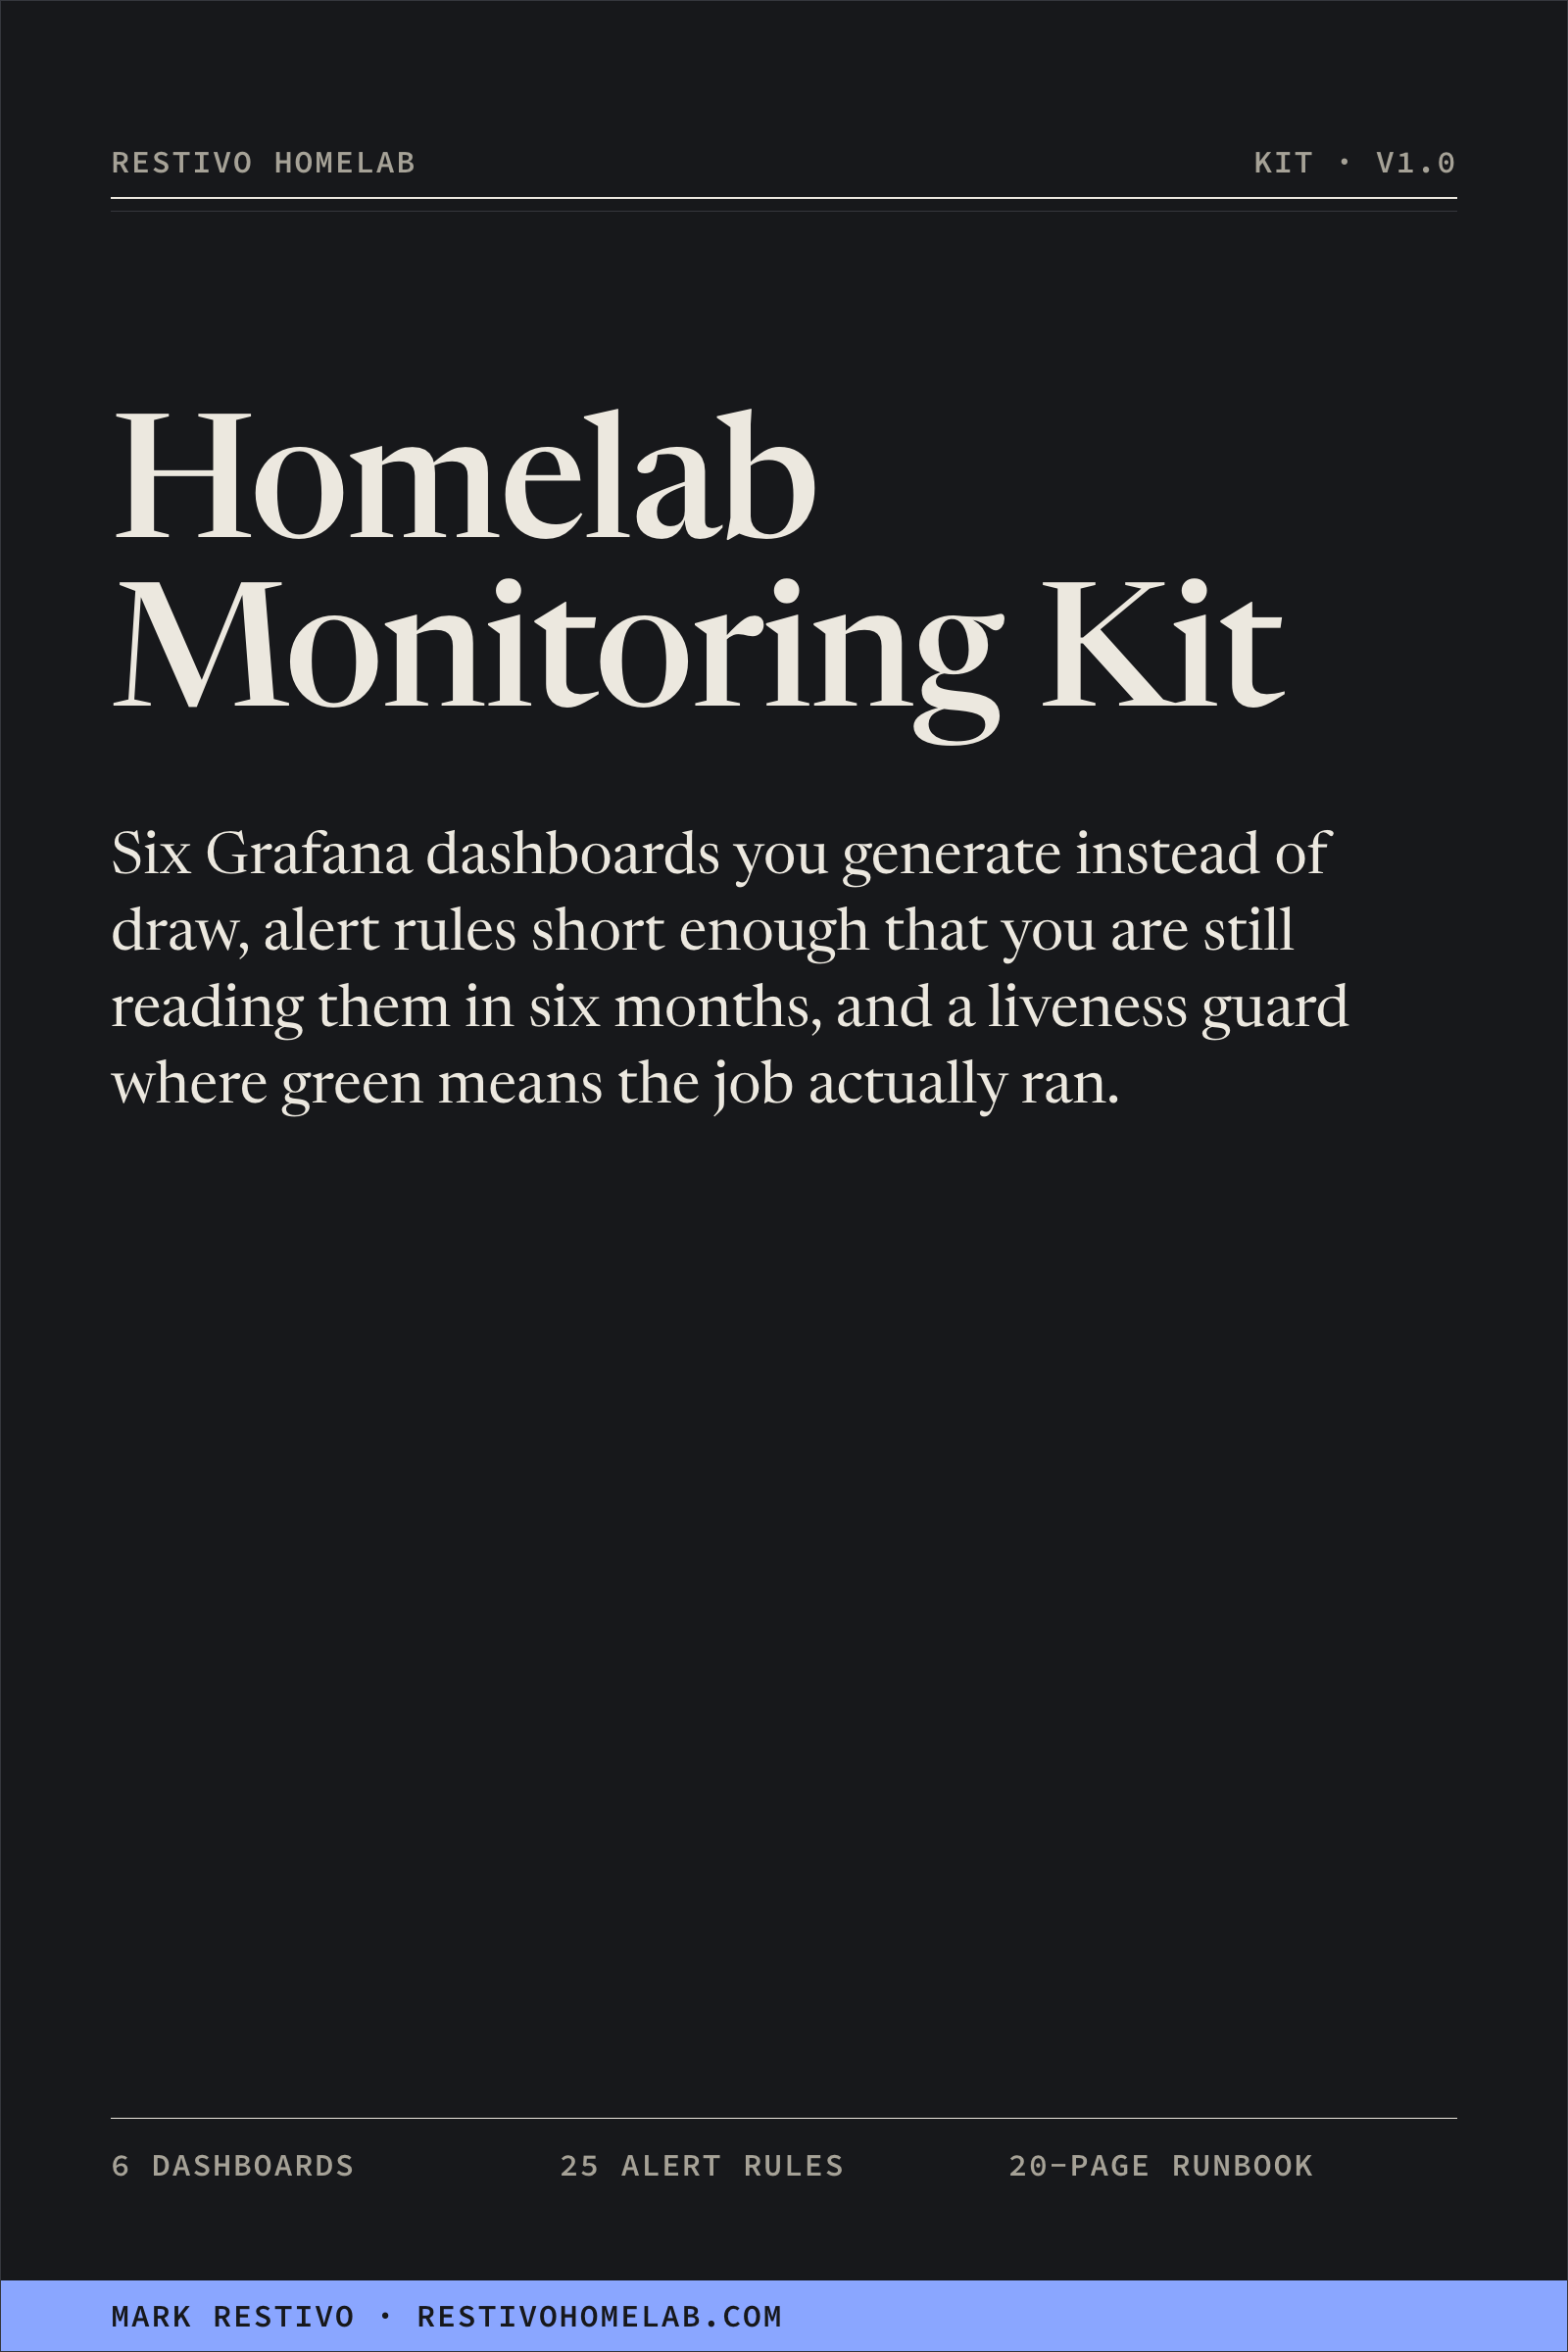
Homelab Monitoring Kit
Six Grafana dashboards you generate instead of draw, alert rules short enough that
you are still reading them in six months, and a liveness guard where green means the job actually
ran.
$49 minimum, $59 suggested
Pay what you think it's worth, with $49 as the floor. Team licence (5 seats) $169.
Available September 15. Join the list to get it first.
Version 1.0, six dashboards, a generator, a liveness guard, 25 alert rules, a
20-page runbook and two worksheets, updated September 2026.
Free updates forever. 30-day 100% refund, no questions.
No subscription, no account, no DRM.
Most homelab monitoring ends up in one of two states. Either you have four dashboards you copied
from somewhere, three of which show "No data" and none of which you trust — or you have forty alert
rules firing continuously and you have quietly stopped reading the notifications. This is what I run
instead.
After this you will be able to…
- Change a dashboard without hand-editing 2,000 lines of JSON. Each board is
about eighty lines of Python on a shared style system, and
build.py --check fails
when the JSON has drifted from its source, so hand-edits get caught.
- Trust a panel that says nothing. A missing series renders
unmeasured, never a confident zero, because "we measured nothing" and "the number is
nothing" must not look the same.
- Tell whether a job ran, not whether it is enabled. The liveness guard derives
status only from the age of the last success, so a job that stops decays to stale and then dark
on its own, with no cooperation from anything.
- Keep an alert list you still read. Twenty-five rules instead of eighty. Each
states how bad it is, points at a section of the runbook, and carries a comment explaining why
its threshold is that number.
- Stop the notification flood without turning alerting off. Dedupe, inhibition,
severity routing,
repeat_interval, and the one rule that keeps a list readable: no
alert without an action.
The two ideas
Dashboards are generated, not drawn. Six hand-maintained JSON files drift. The
generator enforces the house rules with assertions: every panel has a description, no panel
hardcodes a datasource, no two panels overlap.
Green means it ran. This came out of a real failure — a status tile that was
green for nine days while the machine running the job was off. Nothing alerted, because nothing had
failed. Things had simply stopped happening.
What's in the download
- Six Grafana dashboards as importable JSON — overview, hosts, Proxmox nodes and
guests, storage and backups, services and containers, job liveness. Every panel references a
${DS} datasource variable, so they import into any Grafana and work.
- The generator —
lib.py style system, build.py, and a
deploy.sh that pushes to the Grafana API from environment variables.
- The liveness guard —
liveness.py and a one-line
liveness.sh wrapper you put in front of a cron line, plus systemd units and a cron
example. Records last run, last success, exit code and duration; exports Prometheus textfile
metrics and a JSON status.
- 25 alert rules — disk (85/95/inodes/72-hour trend), memory and OOM, backup
age, job stale and dark, host and endpoint down, cert expiry, and the rules that watch the
monitoring stack itself.
thresholds.md — one line per rule on why that number and not
another.denoising.md — dedupe, inhibition, severity routing,
repeat_interval, and a working alertmanager.yml.- 20-page runbook, PDF and Markdown — install, scrape config, import, wire the
liveness guard, tune the alerts, an incident runbook the alert rules point at by name, and the
traps: the Grafana version trap, the
job label trap, the cluster-exporter
multiplication trap.
- Two worksheets — a monitoring inventory whose real job is the gap list, and a
fifteen-minute quarterly alert review.
Everything is plain text: Python, YAML, JSON, Markdown, one PDF. Python standard library only, no
pip install. No app, no account, nothing that stops working if this site does.
Who this is for
- Anyone running Prometheus and Grafana with node_exporter. That is the whole
requirement.
- People whose dashboards have stopped being believed. The generator is the
answer to six boards you can no longer maintain by hand.
- Anyone running scheduled jobs they assume are still running. The liveness
guard is worth the price on its own if you have ever been wrong about that.
Vendor-neutral. The Proxmox, container and endpoint boards need their exporters; without them
those panels read unmeasured rather than breaking.
FAQ
Do I need Proxmox, or Docker, or the exact stack you run?
No. Prometheus, Grafana and node_exporter are the only requirements. Nothing in the kit is tied to
my hardware — no hostnames, no IPs, no tokens.
Is this just some dashboard JSON I could download for free?
The JSON is the smallest part. What you are buying is the generator that keeps six boards
consistent as you change them, the liveness guard that catches jobs that silently stopped, and the
alert rules with the reasoning for each threshold written next to it. Free dashboards give you
panels; this gives you a system you can still maintain in a year.
Do I pay again for updates?
No. Free updates forever. The same download link always serves the newest version, and you get an
email when one ships.
Do you do refunds?
Yes — 30 days, 100%, no questions asked. Email me and I'll refund it. You keep the files.
Was AI used to write this?
The dashboards, the generator and the liveness guard are what I run in my own lab, and the
nine-day green tile was my own. I used AI as an editor to tighten the prose.
Are there reviews?
Not yet. I'd rather show none than invent them. The first buyers get asked for a one-line review,
and those go here when they exist.
Buy the kit
Not ready to buy? Take the 96-item Homelab Ops Checklist, which costs
nothing, or read the guides.
Made by a working sysadmin who runs this lab. About Mark Restivo.